New Frontiers in Non-Target Screening: Roundtable Symposium
The Analytical Scientist, in collaboration with the International Conference on Non-Target Screening (ICNTS) , presents a roundtable symposium exploring emerging frontiers in non-target screening (NTS), spanning pharma and metabolomics, food science, environmental analysis, and materials and process monitoring. As non-target screening continues to expand, the field is being reshaped by advances in high-resolution instrumentation, data analytics, and workflow design. Across disciplines, researchers face common challenges: extracting meaningful insight from highly complex data, building robust and scalable analytical pipelines, and translating discovery-driven workflows into tools that support real-world decision-making.
This session will feature four short, focused presentations , each highlighting cutting-edge developments at a distinct NTS frontier, followed by a moderated roundtable discussion and live audience Q&A . By bringing together perspectives from diverse application areas, the symposium aims to foster interdisciplinary understanding, surface transferable best practices, and identify shared solutions to common analytical challenges. Together, the speakers will examine how non-target screening can evolve toward more integrated, sustainable, and broadly applicable analytical frameworks – and what will be required to bridge gaps between disciplines.
The presentations will cover:
Pharma & Metabolomics – Strategies for Non-Targeted Metabolomics
Food Science – Non-Target Screening of Protein Modifications
Environmental Analysis – Scalable NTS Workflows for Chemical Risk Prioritization
Materials & Process Monitoring – NTS in Industrial and Chemical Processes
Speakers
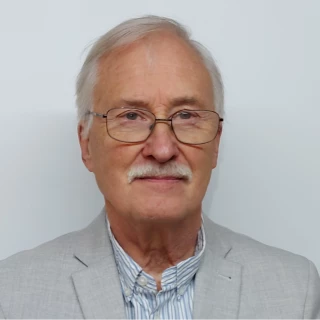
Ian Wilson, PhD After obtaining a PhD from the Chemistry Dept. at Keele Univ. and a Post Doc. at UCL Ian Wilson joined Pharma, (Hoechst, ICI, Zeneca and AstraZeneca) finally moving to Imperial College (London) in 2012 where I am currently a Visiting Prof. and also a visiting Prof at Liverpool Univ.). He uses a high resolution, high throughput non-targeted methods to study metabolic phenotyping (metabonomics/metabolomics), drug metabolism, systems biology and the microbiome. These studies have resulted in ca. 600+ publications and various awards in separation and analytical science from e.g., the RSC and the UK Chrom. Soc.
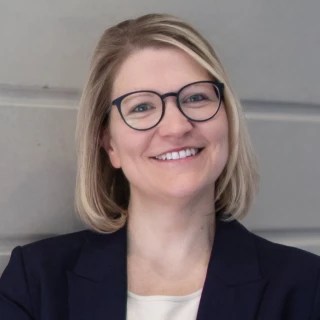
Sabrina Gensberger-Reigl Dr. Sabrina Gensberger-Reigl is a tenured senior scientist specializing in food chemistry at Friedrich-Alexander-Universität Erlangen-Nürnberg (FAU), where she has been employed since 2015. She holds a doctorate in food chemistry with expertise in reactive glucose degradation products in food and medical applications, along with dual state certifications as a food chemist
Her career combines strong academic credentials with international research experience, including a research stay at The University of Tokyo. Dr. Gensberger-Reigl has recently distinguished herself through excellence in both teaching and institutional innovation, receiving the 2025 Ars Legendi Faculty Award for outstanding university teaching in chemistry and the 2025 Renate Wittern-Sterzel Award for establishing a pioneering maternity protection laboratory at FAU. Her work demonstrates sustained commitment to advancing food chemistry research while championing supportive academic environments for working parents.
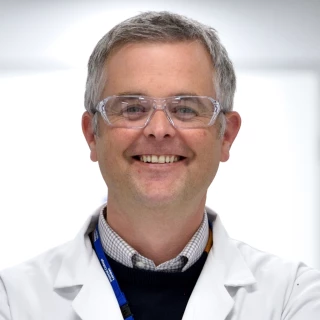
Leon Barron Dr. Leon Barron is Professor of Analytical and Environmental Sciences at Imperial College London. He holds a BSc(hons) and PhD in analytical chemistry at Dublin City University, Ireland. He was Lecturer and then Senior lecturer in Forensic Science at King’s College London for 11 years until 2020 when he moved to Imperial to lead the Emerging Chemical Contaminants team within the Environmental Research Group. His research aims to further our understanding of the sources, risks and impacts existing, emerging and new chemical contaminants on environmental and public health including through non-target screening.
Stefan Bieber Dr. Stefan Bieber is a co-founder and executive director at AFIN-TS GmbH and has worked for many years in developing Non-Target Screening strategies.
He is responsible for the development, utilization and communication of new and innovative analytical technologies in the field of non-target screening. These include polarity-extended chromatographic techniques, such as SFC coupled to high-resolution mass spectrometry, but also data evaluation concepts for non-target screening.
Stefan Bieber has studied bioprocessing engineering (B.Sc. and M.Sc.) at the Technical University of Munich. Subsequently, he was a Research Assistant in the Analytical Research group at the Chair of Urban Water Systems Engineering Technical University of Munich. In his PhD thesis, he investigated and assessed national and international management strategies for trace organic compounds and supporting advanced analytical techniques for the detection and monitoring of trace organic compounds in environmental waterbodies.
Rob Plumb After obtaining BSc in Chemistry in 1992, Robert Plumb worked at Glaxo R&D in Drug Metabolism Department during this time he obtained a Ph.D in Chemistry from University of Hertfordshire. In 2001 he moved to Waters Corporation, MA, USA where he is currently a scientific advisor in the LC-MS organisation and is also a visiting Prof. at Univ. Liverpool. His work focuses on high resolution LC and mass spectrometry for DMPK, metabolic phenotyping and discovery omics, which has resulted in more than 160 peer reviewed publications.
Hello and welcome to today's roundtable symposium organized by the Analytical Scientists in collaboration with the International Conference on Non-Target Screening. My name is James Strachan, editor of The Analytical Scientist, and I'm delighted to be your moderator for today's event, which we'll discuss new frontiers in non-target screening. This session will feature 4 short presentations, each highlighting distinct developments in an NTS application area. This will be followed by a moderated roundtable discussion and live audience Q&A. Our first two speakers today are Ian Wilson and Rob Plumb, who will cover pharma and metabolomics strategies for non-targeted metabolomics. Ian Wilson is a visiting professor at Imperial College London and the University of Liverpool. Rob Plumb is a scientific advisor at Waters and also a visiting professor at the University of Liverpool. Our third speaker is Sabrina Ginzberger Riegel, a senior scientist specializing in food chemistry at FAU in Nuremberg. Her presentation will focus on the untargeted profiling of post-translational modifications in food proteins. Our 4th speaker is Leon Barron, professor of analytical and Environmental Sciences at Imperial College London. Leon will present innovative strategies for large-scale environmental screening. Our 5th and final speaker is Stefan Bieber, co-founder and executive director at AffinTS. Stefan will cover NTS in industrial and chemical processes. Our speakers will be on hand to answer questions at the end of the presentation, but you can submit questions at any time throughout the webinar. OK, we're now ready to start the presentations, so I'll hand over to our speakers. Hello everybody, my name is Ian Wilson and I'm going to talk to you today about how we use untargeted metabolomics in pharma or how we could use it, which is not necessarily the same thing. Now, you'll realize that my title was non-targeted, but whilst I've been putting this presentation together, I've begun to realize that people use non-targeted and untargeted in slightly and subtly different ways. I'm going to be talking about untargeted metabolomics, which my colleague Rob Plumb, who you'll also see on the slide, and I have been doing probably since the 1980s, um, with techniques like NMR spectroscopy and since the early 2000s, LCMS. So let us begin our journey through this. So there are a whole variety of different types of metabolic phenotyping. The type I'm going to talk about is essentially totally unbiased, or the aim is to be unbiased, although obviously the analytical method that you use does bias it. Um, it's based on large panels of metabolites to be analyzed, a wide dynamic range required because the concentration ranges for these things are huge, over a wide polarity range, because some are very polar and some are very non-polar and a whole load are in between, and using high resolution mass spectrometry. Now, in my view, this is untargeted. A second type of uh What is currently called untargeted metabolomics is actually uses large panels of known metabolites, um, has a wide dynamic range, still required, um, but the acquisitions tend to be using multiple reaction monitoring. Standards are often available, in fact, these methods are generally built on standards. So perhaps it's really non-targeted, similar to analyzing for a whole panel of pesticides in water, where you don't, Know what you'll find, but you expect to find, or you're looking actively for some of them, but not for any individual one. Um In metabolomics we've also got moving into targeted semi-quantitative and fully targeted quantitative methods at the end, so there's a range uh that are used uh in parallel, in series, in order or not. So in untargeted metabolic phenotyping, What we're really trying to do is metabolite discovery. So these methods are meant to be hypothesis free, we don't know what we're looking for, but hypothesis generating, or when we find what we're looking for, or what we, what has changed in the samples, we generate a hypothesis based on biochemistry. As I say, they're meant to be unbiased in what is detected. So the important thing is the analytes that are going to be of interest to us are unknown beforehand. And sometimes because we haven't fully mapped the metabolo remain unknown afterwards, but the aim is not quantification. Or detection of known knowns if you like, but seeing what has changed in the metabolo. And if we look at a sort of a little workflow like this, we start at the top, we're doing this global metabolite profiling. Metabenomics, metabolomics or metabotyping in analogy to phenotyping. This, um Right at the top is in discovery mode, we don't know what we're looking for and we don't know what we've found, but we hope it will be of interest. Now when we begin to understand the things that we've found, the things that have come up in the profiling, we start to work with targeted methods, targeted classes, like. Pathways like Krebs cycle pathway, or central carbon, um, or classes like amino acids or carnitines. And from the targeted pathways we go to confirmation through specific assays, deliberately designed to look for those things that are important. And we hope to be able to apply them. And uh just to try and Uh, raise the, the, the standard a bit. I thought we might employ a Latin phrase which I discovered recently while putting this together, in fact, which, um, follows very nicely on this notitia de cognittonio. I'm sure I've mangled that, um. Information to knowledge. Actually it should really be data to information to knowledge, but that takes up a bit too much room. So, ideally, in a, in a simplified way, we would follow the direction of the of the arrow, start with um, Unknown. Targets, move our way through targets that we begin to understand and then end up with assays for half a dozen specific biomarkers that give us a panel. That allow us to use these things to, to see what's going on and also generate hypotheses that tell us what pathways are being affected by whatever it is that we're doing. And all of this applies whether we're in pharma or, Just biochemistry in general or in food even, you know, the, the same principles apply. So there is a sort of a workflow. Obviously it all begins with the study design. If you get the study design wrong, any data you generate will be elegant but meaningless. We then move into sample collection. Um, which requires, you know, great care, you have to collect the sample properly and in the same way generally, and then we move to the analysis. And from the analysis we get data, we need to provide QC and um. Do some fancy statistics and things and do metabolite identification, and then we'll get candidate biomarkers. Now, identifying these candidate biomarkers requires a lot of effort. But when we've got them and validated the things we thought we'd found are there, let's say we can use these markers to generate hypotheses. We can replicate them in other sample sets to prove that it's not just a one-off and an artifact of the assays we've done. And then we go to biomarker panel generation and method validation for the sort of things that would give you really sound information on what's happening. So let's look at those stages, um, with sample collection, one of the things we need is to ensure is stability. There's no point in collecting samples if having come to the, to analyze them, you find that everything has gone off, so we need to, Carefully prepare uh systems for storage, storage in freezers and on the benchtop in the altar sampler, how many times can you freeze store a sample and how many times, Can you transport it around to different laboratories, you know, can you do that, in fact? Then we need to do the sample preparation when we come to the analysis, and the ideal is to do the absolute minimum that you need to. That way you, you can um, Be fairly sure that your analysis is unbiased, so we use solvents, need to evaluate all of the things you see here, get them right, then we come to the analysis, the chromatography. Uh, we're doing LCMS obviously, so we need to, uh, have stable retention times, reproducible analysis, peak shape needs to be good, resolution needs to be excellent, ideally it's selective, and it needs to be robust. Similarly, the mass spectrometer in these areas needs to be accurate, sensitive, with good signal stability and a wide dynamic range. So here we get to um sample analysis and the run design. So we've got, let's imagine we have a group of samples from a test group and a control group, um. How do you make an analysis sound when you don't know what's in it? And the way we've addressed this is to make QCs and run them through the sample set. Um, and we make the QCs from the samples that we've collected, so we take a little bit of each sample and, uh, mix it and run these QCs at regular intervals through the run, and the typical run sequence is shown below. And the pool study samples which provide the QCs can also be used as a simple system suitability test, you know, you can look at the QC afterwards, the QC runs and say, oh yeah. Uh, this system works pretty well. Now, one of the things that we're trying to do is to cover as much of the metabolism as we can. And clearly the chromatography will define what you see. So this is the same sample analyzed on the left hand side by Hille. Uh, hydrophobic interaction, liquid chromatography, and on the right hand side by reverse phase, liquid chromatography, and you will see, unsurprisingly, that the chromatograms look different. Hili is particularly good for polar metabolites, and reverse phase for mid to non-polar metabolites. Now by analyzing your samples in both modes. You get Increased coverage. Um, And What does that look like? I'm going to show you now for one iron. And this is uh RPLC and Hillock for the iron that was MZ at 160.604, and one of the things you'll see and one of the justifications for using chromatography is there is more than one iron with that mass. Now, if you look in the reverse phase, you'll see that this iron is fairly polar, or most of these ions are fairly polar, eluting quite early in the separation, whereas in Hille, there's a lot more separation and retention. Now what I can't tell you, because we all know that the mobile phase that you're using will affect the ionization efficiency, is, is the big iron you're seeing at 10 at 1.46 minutes in the reverse phase, the largest iron there, the same as the one that is diluting at 5.36 minutes in the hillock. Um, and the chances are that it's not, and linking, reducing the redundancy or eliminating the redundancy in the two methods is interesting, but nevertheless, if you have data, you can deal with it. So let me show you now. The sort of data you're getting. So this is a top-down view with mass on the left and retention time uh on the ordinate. There are an awful lot of features in this. And the big question is, which ones are the biomarkers? Because identifying everything in the chromatogram is both, would be both very time consuming and pointless if nothing has changed between the control and the test group. So how do we deal with these huge masses of data? OK, so we analyze the samples and we get the mass chromatograms with all the data in, we obtain robust information. Information rich data. On the composition of these samples. Then we identify the differences between the two groups or the 3 groups or the 4 groups between the groups using multivariate statistics on the data. And then we concentrate on the retention time. Mass pairs That define the differences in and we identify what those components are. We don't investigate everything, only what changes. So here are two examples, Hille and reverse phase data on the same samples, these happen to be um, Rats with uh they're zuka rats, so some of them are genetically fat or will grow fat and some of them are pretty normal. Um, so the, the black is the normals and red is the. Genetically fat, and as you can see, multivariate analysis separates them into groups, and both methods, Hillock and reverse phase, separate these groups, and interestingly, both separate them on, based on different biomarkers. So you have a huge amount of information you can chase up and say, what defines the difference between these obese animals and these normal animals. And that's what we're after. Now, where does this have an opportunity for pharma? Well, obviously very simply. If you're trying to find biomarkers that are predictive of the effects that you want, all the way through to discovery and development and to launch and possibly thereafter. Knowing what's going on, knowing what your drug is doing, knowing how your patient or your animal is responding, um, can be very useful, and we're going to show you an example of how metabotyping could be useful in drug discovery. We're going to show you a small scale study in mice on a drug called gefitinib, a tyrinese a tirazine kinase inhibitor, and the study was designed to determine the metabolism and pharmacokinetics of the drug, as you might want to do early in discovery, but also to look at effects on the metabolism. And here we're going to show you the oral, Arm of the dose In my So Here we are, uh, there's the drug, nice. Little drug, uh, we're dosing these mice at 50 mg per kilo, we're collecting plasma and urine for DMPK and for metabotyping, um, and if you look at the slide, you can see we're collecting pre-dose samples of plasma all the way through to 24 hours, and similarly urine all the way from pre-dose to 24 hours. So the first thing we're going to do is look at the pharmacokinetics. And here, if you look at the graph that's just appeared at the top, um, there's gefitinib itself and going down the, the major circulating metabolites, um, and they're all falling, following pretty much the same pathway in terms of same curve in terms of concentration pro time profiles, but with obviously gefetinib dominating. OK, I've told you that gefitinib is a tyrosine kinase inhibitor, but what does that mean biochemically? That's why we're doing the metabolomics. So here again is some multivariate statistics. What we have on the left is the same sort of picture that I showed you for the earlier for the rats, Suzuka rats, with far fewer samples because we're using an absolute minimum number of animals, but if you look carefully, you can see we start off here in the pre-dose region where all the animals are pretty much the same. We dose them, there's animals showing independence of uh a response, but what's essentially happening is it's going round in a circle like that and heading back towards the pre-dose profile. On the right-hand side, you'll see this heat map. These here are mostly the um pre-dose, and as you work through here, we've got different times, different colors for the different times and down here's a whole load of uh TRNZ, Numbers which show you the things that are changing. An easy way of looking at it is this. So here we're just looking at some of the things that are changing, and as you can see, here are all the all the pre-dos that includes the controls and the test, and now from now on we're looking at the things that are up regulated. With dosing in the time periods that we have, and down regulated, but now only in the animals that were dosed with cofitinib, but compared to the pre-dose, and as you can see, some go up. Some go down What happens if we start looking at those in some detail? So This is the plasma profile that we discussed earlier for the metabolites with gefitinib as a dominating. Here we have a number of compounds which are seen to change. Now, on the right hand side of each of these pictures is the vehicle, which is really not doing very much. And here we've got things that are going up and peaking. In a similar way to the pharmacokinetic profile, so it's reasonable to suggest that maybe these have got something to do with the pharmacological activity of the drug. If we now move to plasma and do a little bit of untargeted lipidomics, same sort of thing, we have pre-dose samples. We move out pretty rapidly as the concentrations of the drug build up and then work our way. Slowly back from 0.1 hour to 0.25 hour, 0.75, until eventually we're coming quite close to the pre-dose again. So with the lipids we're also seeing what we're calling a pharmacolipidodynamic effect. The drug affects certain lipids. And here's a, a graph that shows it for one. The orange one is the lipid, which goes up, and it, you'll see it's going really in lockstep with the PK profile of cofitinib. Um, Which is initially rising, coinciding with a fall in the amounts of the lipid and then going down. If you plot, as we have done here, concentration of drug versus concentration of lipids, you'll see that we're getting a really rather nice straight line. I mean it's not perfect, but this is biology, it would be really worrying if it was absolutely perfect. But it's still got an R 2 of 0.8. And if we look here, That's that again, for lipids to performing in another way, they're going up, etc. You get another different set of um. Correlations. I think based on this you can believe, if you want, that you're seeing something that is worth following up later and checking out in different models and possibly in patients. You can look for lipids that might be changing that are indicative of the effects of the drug. So in summary, in fully untargeted metabolomics, you don't know what to look for until you've found it. Once you find it, you need to identify it. Once you've identified it, you need to work out why they're there and what they're doing. The benefits to pharma of doing this in discovery are manyfold. It might provide clues to the mechanism of action of the drug, might indicate off-target pharmacology, and may provide an initial view into toxicity. They may, in addition, provide translatable biomarkers of efficacy or adverse drug reactions. So, what's not to like? And the good news is that uh if what you're really, your main aim was, which was to get the DMPK. Well The samples that you have leftover or even the same samples can be used to give you all this additional biochemical information, so you know, you get your DMPK for nothing and your uh efficacy for free. Thank you. I hope some of that was interesting. And don't forget information to knowledge. Hello everyone. My name is Sabrina Gensberger Reigel. I'm a senior scientist at Friedrich Alexander Unit Erlangen Nuremberg in northern Bavaria, Germany. First of all, thank you to the organizers for the kind invitation. And I would also like to acknowledge my co-authors Dr. Andreas Mauser and Professor Monica Pischetzrier from the Chair of Food chemistry for the valuable input and for shaping many of the ideas I'm going to present today. Today I will talk about the analysis of non-enzymatic protein modifications, which we abbreviate NEPTMs. I will focus on 3 main questions. First, what are any PTMs and why do we care about them in foods and beyond? Second, what makes NPTMs analytically challenging, especially in complex food matrices. And third, how can we improve any PTM identification using untargeted LCMSMS workflows? So let's start. Proteins are central to both nutrition and food technology. From a nutritional perspective, they provide essential amino acids and contribute substantially to protein quality in the diet. From a technological perspective, proteins determine important product properties. They influence texture, solubility, emulsification, forming behavior, stability, and elation, basically many of the properties that define how a food appears and behaves. But proteins are also reactive molecules. During processing and storage, proteins can undergo chemical changes. One important class of changes is the formation of any PTMs. Some NPTMs are actually beneficial. They can contribute to desirable sensory characteristics. For example, they are part of the chemical processes that lead to browning and flavor formation. However, any PTMs can also reduce the nutritional value of proteins. Especially essential when essential amino acids are modified. Lysine is a typical example for that. It is nutritionally essential, but it is also highly reactive. When lysine becomes modified, it can become partially or fully unavailable. This matters particularly in products designed for vulnerable groups such as infant formula. In this context, studies suggest that around 15 to 20% of lysine can be blocked by any PTMs, which directly impacts amino acid availability. And beyond nutrition and sensory aspects, any PTMs can influence technological properties as well. They can change solubility, protein stability, aggregation behavior, and gelling capacity. So any PTMs can affect how well a protein performs as an ingredient. Finally, any PTMs are not only relevant in foods. They can also be quality parameters in protein-based pharmaceuticals where chemical modifications may affect stability or efficacy. So overall, understanding how proteins are modified is essential if we want to optimize food quality, maintain nutritional value, and understand functional behavior. So far proteins matter and their non-enzymatic modifications matter. NEPTMs comprise several reacting classes and a very broad structural diversity. One major pathway is glycation chemistry. Glycation can generate a range of so-called advanced glycation end products and related structures, such as carboxymethyllysine, immidazoline derivatives, and many other products. Another important pathway is oxidation. Oxidation can generate modifications such as methionine sulfoxide or hydroxytryptophan. A third important pathway is deamidation. Diamidation converts asparaggene and glutamine to their corresponding acids, that means aspartic and glutamic acid. And beyond these, there are additional pathways such as isomerization, condensation, and elimination reactions that produce further modification types. Now what makes it so complex analytically? Proteins contain many different amino acids, and modifications can occur on different side chains. They can occur multiple times at multiple sites within the same protein. And a single protein molecule can carry several different modification structures at the same time. In real samples, especially foods, we also have mixtures of many proteins, each with its own sequence, its own digestion pattern, and potentially multiple modifications. As a result, the number of possible analytes becomes very large, and their abundance distribution can be very broad. So we need methods that can handle this complexity and still provide confident identifications. At this point, the key question is, what do we actually measure when we analyze any PTMs? From a mass spectrometry perspective, a NEPTM introduces a defined change in mass on an amino acid residue. This change is called mass shift, and mass spectrometry detects these mass shifts. For example, the formation of carboxymethyllysine on lysine residues leads to a mass increase of +58 daltons. That is a very concrete signature, a defined mass difference relative to the unmodified residue. So in principle we could search for mass shifts, detect them, and assign a modification. But in practice, this is where the major challenges start. One key challenge is that the same mass shift can result from different chemistries and can occur on different amino acids. To stay with the plus 58 Dalton example. A glyoxyl derived dehydroxyimidazole on arginine can also show a + 58 Dalton mass shift just at a different residue. So my shift alone is not enough. We need more information to address any PTMs analytically. A challenge is positional diversity. Even for one modification type, it may occur on different residues at different positions across a protein. Another challenge is sample complexity. Food matrices contain many proteins. This matrix complexity increases dynamic range and makes detection of low abundance modified peptides more difficult. So our analytical goal becomes very ambitious. We want a site-specific detection of any PTMs in complex mixtures, ideally detecting many modifications simultaneously. To do this, we can use bottom-up proteomics with untargeted LCMSMS and careful data evaluation. In a bottom-up proteomics approach, proteins are enzymatically hydrolyzed into peptides. After sample cleanup, the peptide mixture is analyzed by LCMSMS. For enzymatic hydrolysis, different enzymes can be used. Each enzyme has a specific cleavage pattern, and that affects which peptide sequences we observe and how well we cover the protein sequence. Trypsin is a common enzyme in proteomics, but in food proteins and in highly modified systems, other proteases can be very useful depending on your question. The chromatographic separation helps. Reduce complexity and improve sensitivity. Then in tandem MS, peptides are fragmented and we record fragment spectra that contain the information needed for sequence identification and localization of the modification. After LCMSMS acquisition, the data are evaluated by using specific proteomic software applications. The software matches experimental spectra to peptide sequences. We control identification confidence using false discovery rate approaches, and the final output is a list of identified peptides, including modified peptides. Now an important point. In untargeted approaches, we are not only looking for pre-selected, pre-defined modifications. Instead, we allow the data to reveal what modifications are present. Within the limits of our search space and our databases. So the success of untargeted NPTM profiling depends strongly on two pillars. First, the database content, and second, the search parameters, and that brings us to another major bottleneck. Many standard PTM databases, such as general purpose resources accessible through Uniro, for example, are not tailored to food matrices. They often focus on enzymatic PTMs and biological systems. Food relevant any PTMs, however, are largely chemistry driven and depend on processing conditions like heat, storage time, reaction partners, or oxygen exposure. So if our search space does not contain the right modifications, we risk missing relevant NEPTMs, and if we include too many poorly validated modifications, we can increase false positives and reduce confidence. This is exactly why created context-specific NEPTM databases are essential for reliable profiling in food systems. So how do we build such a database and how do we include novel NPTMs? A first approach is a structured literature search. This is very useful because it captures validated knowledge and helps define a reliable starting point of known food relevant modifications. But there is a limitation. Literature searches are limited to what is already known and described in food systems, novel NEPTMs can be formed, especially under specific conditions or with specific reaction partners. So we also need experimental approaches to find new modifications and validate them. I will briefly summarize two strategies we used. One approach was performed by Lisa Gadelmeyer, formerly Attzenbeck, using model peptide and a glycating agent. After reaction, several new peptide species were observed. Specifically, 4 distinct mass shifts were detected, indicating the formation of new products and potential NEPTMs. Now this is where Tandem MS becomes very powerful. When we fragment peptides in tandem MS, cleavage typically occurs along the peptide backbone, generating characteristic fragmention series, for example, so-called B and Y ions. These fragment series allow us to localize a modification. Conceptually, if fragments up to a certain position show the unmodified mass and fragments beyond that position show the mass shift, we can pinpoint where the modification must be located. In this example, we use tannem mass spectra. We were able to localize a novel modification to a sustein residue. As the y ions to the left showed the distinct mass shifts and the y ions to the right did not carry this mass shift and vice versa for the b ions. However, localization is not the same as structural conformation. So we then used NMR to confirm the chemical structure, and once the structure is validated, it can be confidentially added to the NEPTM database. A second approach to identify novel NEPTMs was performed by Yasmin Meltrater and Johannes Wust. Here, a model protein was used under conditions designed to enhance any PTM formation. Full mask scans were acquired, combined with high resolution tandem MS data. Features were detected and evaluated using software tools that allow for untargeted screening, for example, XCMS. Again, tandem MS fragmentation plays a central role. If a peptide carries a NEPTM, the fragment series reflect a mass shift, and in many cases we can identify indicator fragments that support localization. In this workflow, identification is driven by tandem mass spectrometric data and supported by synthesized reference compounds for validation. By combining literature knowledge and experimental approaches, we established a curated database containing more than 50 different NEPTMs. Now what happens when we apply this in an actual profiling experiment? Andreas Mauser used this created NEPTM database for NEPTM profiling in alpha-elect albumin, a major milk protein. In this model, alpha-lactaline was incubated with lactose to induce any PTM formation. Lactose is of course the relevant milk sugar, and incubation promotes the formation of any PTMs. After incubation, the protein was enzymatically digested using the protease glu C, which typically cleaves peptide bonds after glutamic and aspartic acid. Then Andreas applied the untargeted LCMSMS workflow and screened for modifications using our curd database. When screening this model for any PTMs, we found that deamidation was the major modification. Deamidation typically occurs on asparag and glutamine, converting them into aspartic and glutamic acid. Now here's the key point, and this is where chemistry and analytics intersect directly. Aspartic acid and glutamic acid are exactly the amino acids that serve as gluey cleavage sites. So deamidation creates new cleavage sites within the protein sequence. In other words, the modification changes the digestion pattern and therefore changes which peptides were generated and detected. This is a very important lesson. Any PTMs can influence not only protein properties, but also the analytical workflow itself. What did we do with that observation? We adapted the enzyme settings in the software search to reflect this behavior. And this improved the outcome substantially with the adapted settings. We identified more than 500 peptides compared to roughly 300 peptides using default parameters. So simply acknowledging the chemistry and translating it into appropriate search settings improved peptide coverage and identification rate. This example shows two things. First, any PTM can change digestion pattern. Second, parameter settings can have a major effect on what we identify. So what do we take from this for any PTM profiling more generally? First, curated context-specific databases are essential. If the database contains validated and relevant NEPTMs, the risk of false positives and false negatives decreases. Second, default software parameters are often not optimal for any PTM profiling. Investing effort in search space design and parameter optimization improves sensitivity, reproducibility, and identification rates. Third, there are still challenges we need to address in the future. Low abundance modifications or chemically unstable modifications can remain undetected. Peptide terminal NEPTMs are still difficult to capture reliably because they often generate very few indicator fragments in tandem MS. And when multiple NEPTMs occur on the same peptide, spectral interpretation becomes increasingly complex and confidence can drop. So even though untargeted workflows are powerful, there is still some work ahead, especially regarding detection limits and robust localization for challenging modification types. To conclude Non-enzymatic protein modifications are key determinants of protein quality. Untargeted proteomics workflows are powerful tools to capture both known and unknown modifications, but success depends on tailored database content and optimized parameter settings. In milk and milk products, what we have learned so far is that more heat leads to more NPTMs. We are currently extending this work to additional products, including infant formula to gain deeper insights into the NEPTM profiles of these matrices. Finally, this will help us develop better markers linked to nutritional and technological properties and contribute to producing better and more stable foods. With that, I would like to thank our funding partners, my colleagues at the chair of Food chemistry, and of course all of you for your attention. Hi there, my name is Leon Barron. I'm a professor of analytical and environmental sciences at Imperial College London. Today I'm going to talk about non-target screening in environmental analysis and specifically how we've over the last few years scaled up our workflows for chemical risk prioritization. Today I'll focus mainly on water and new strategies to do this, but also including a little bit of information about our new passive sampler that we've developed for multimodal analysis. So our chemical planet is very complex, as, as you know, um, and, um, climate change, uh, biodiversity loss, and, uh, pollution represent the triple planetary crisis currently. As you can see here in the, in the diagram, as part of the planetary boundaries framework, novel entities is in the high risk category. And really this is reflected in the numbers on the left, so we've got very large numbers of structures that are predicted to exist in the small molecule range over 1060, and then on various databases we've got several 100 million substances. Currently archived and reviewable. The global inventory suggests about 360,000 chemicals have been, have been inventoried for, for global commerce globally, and that represents only 19 countries. And even within one particular regulatory framework, the EU Water Framework Directive, fewer than 100 chemicals are currently prioritized or considered chemicals of emerging concern. So really, we don't know an awful lot about these chemicals in order to categorize their, their potential impacts in the environment, and that's really as a result of the ability to be able to measure them all in a variety of different complex media, uh, reliably using both targeted and non-targeted approaches, as well as a combination of techniques together. So the chemical space in itself is very, very complex, and specifically looking at analytical methodologies, um, every decision and every layer of that of that analytical methodology narrows or adjusts or modifies the potential measurable space as you can see here on the top. Everything from the type of matrix. tricks you're you're using, the extraction approach, the chromatography, if you use it, the mass spectrometry approaches and, and the various parameters, all define the measurable space, the boundaries of it, but also, uh, whether things can be ionized efficiently within this space and that there are no gaps even within the measurable, uh, space itself. So in terms of scalability then, really, I've just listed 4 priority ones here, but really it's about spatial temporal coverage. Uh, we can't test everywhere all the time and so certain decisions and compromises have to be made if we're going to do large scale programs aiming to do, uh, as much of that as possible. Possible, but equally the conditions in each of these areas over time may change, and this governs the chemistry. So this may mean, for example, that the form of chemicals you measure will change or have a different toxicology or impact on, for example, aquatic life. The last bit is important to consider as well. I mean, today we just focus on water, but air is connected to water, is connected to soil, is connected to living things, and as a result, we need to make sure that what we're measuring in what sphere is, uh, taken into context with other spheres. Um, so these are the kind of main scalable or scale issues that we, we, we face. For an analytical method, then I've just listed 4 kind of main things that we've, we've tackled over the last few years. Samppling and logistics is by far the most complicated one. It's also the most costly. How do we take samples at a very large scale? How do we get them to the lab in a reliable way so that they can be tested and the samples are, um, you know, kept, kept viable? Um, and that the analytes are stable. Um, also sample preparation for such a large number of samples, you need to be efficient with this. So really fast run times is important, but sample preparation also needs to be short, ideally within the same scale as the, as the analytical measurement, uh, takes. So in our case here, we've just moved to automated, uh, sample preparation or done away with concentrative approaches as part of the sample preparation. Uh, component, including removal of SPE towards more direct injection analytics, which I'll discuss in the main here. The instrumental method is obviously core to this. Um, the selectivity of that, that analytical method to what you want to see defines your, your chemical space, your measurable chemical space, and what, what, what you'll be able to measure reliably, whether it's quantitative, qualitative, and so on. We generally use both qualitative and quantitative methods using targeted and targeted analysis. And the last part, data analysis is, is really quite large now. The data we generate, uh, we can't get through it all, so we have to ask, um, questions or formulate questions before we come at the data to really enable a relatively quick turnaround time for this. But equally to be able to integrate new approaches, for example, using machine learning, to be able to use the data as a whole or in part to do, um, predictive, um, um, uh, projects as well. So really it's a case about cost. These are very, very large scale. Uh, and what coverage of the four points on the right, um, are you able to address with the budget you have? And ultimately, it's got to be practical. You've got to be able to do it in, in, and it's got to be reasonable. Um, so the balance of all three is critical. So, number 3 then, I'm gonna start with our analytical methodology. So the instrumental analysis in our case. I'm gonna focus specifically on our direct injection platforms. There's 2 here. One is our targeted method and we have a core sort of method containing 165 substances. Um, that's separated and detected in about 6.5 minutes runtime, uh, about 5, 5.5 minutes of that. That is the gradient separation, and then the remainder is the recalibration and cycling the next sample ready for injection. So that really means we can do 260 injections in a day. Uh, so roughly, you know, we can do 400 samples in a week per instrument with matrix match calibrations and QCs and blanks and various sorts of things included in the method. Um, so suspect screening is there as well as a, as a, as a, as a tool to augment the target analysis to ensure A, that we're actually measuring what we should be measuring, uh, and B, to obviously widen the scope of what may be present, um, in, in, in samples. Generally, we, we run about 110% of the samples that we run, uh, in, in target analysis on suspect screening. We've got 1200 substances within our method and that's fully curated. Uh, we've got, uh, retention time, MS1 and MS2. We can run in DDA or DIA, um, but generally we go with, uh, data independent analysis. And this has really been, uh, foundational for us, uh, to be able to do direct injection analysis, um, for, uh, wastewater, river water, and also, uh, drinking water. So here's our targeted separation, as you can see, a very nice separation. In this case, this was our first method that we developed, uh, in 2020, um, looking at 135, uh, chemicals of emerging concern. And this method really formed the basis of our national wastewater monitoring program for illicit drugs. Um, and as you can see, very good definition of the peaks, 20th to 13th. Data points per peak, per transition, um, with, uh, limits of detection down to the single digit nanogram per liter range in most cases. If you look at the method of performance across a batch, for example, here you can see constant, um, uh, isotope label internal standard performance across 60 wastewater injections, and you can see very little RSD here in the peak areas. This is an example of that method in in application. So this is where we monitored several sites across England for illicit drugs, uh, influid wastewater, untreated wastewater, and here are three sites that are located about 2 to 300 kilometers apart from each other. Uh, this is the data for the primary metabolite of cocaine, uh, benzyleanine, and you can see across the year it allows you to pull out specific dates in the year where we You can actually see elevated, uh, consumption or activity around, uh, illicit drug use. Specifically, you can see things that you might expect. So bank holiday weekends, um, you know, national holidays, they're, they're all on the upper end in terms of, um, uh, correlation with cocaine use. But also some interesting ones. So specific events like Eurovision Song Contest was a bit of a surprise for us. Uh, but also things like the World Cup Final was there, very, very high use there. Um. But also in the opposite direction, it was very interesting to see when we had a 3.7 ton seizure of cocaine on Southampton docks, we actually saw a massive impact on consumption within each of these locations over a period of a month. So this is very important for authorities to then be able to see what the impact of a seizure would be quantitatively on consumption. So this paper is due to be released later this month, so keep an eye out. But as part of that paper we actually did a lot of suspect screening, so roughly we tested about 1700 samples in a year. We did about 10% of those for, for suspect screening. Many things you would expect to see. So this is our full 1200 compound library screen. So here are two examples. The vaccine is a, is an antidepressant used quite widely in the UK. We expected to see that, uh, but also we were asked, could we find any markers of crack cocaine use as opposed to, uh, the normal powder cocaine, uh, approach. And we can see here, uh, anhydro hydroequinine methyl er, uh, we could put out some signals for that. We've also put In 34 stable isotope standards in here and that allows us to normalize the peak areas across all the different batches and as a result we can start to look at correlations between substances over over space and time. So that's become very useful. We're now starting to finish these these data for publication in 2026. But really one of the questions we had as part of the wastewater analysis program was, could we identify new, new drugs as they emerge. And so we, we saw reports in the news of xylazine being a, a problem. They're, they're, they're kind of, um, labeled as zombie drugs, um, and in this case, there it was found in, in ketamine. Which is, uh, very, very high in terms of consumption in, in the UK. Um, but this xylazine, um, additive is, is particularly damaging. Uh, we were also picking that up in, in wastewater samples, um, across, across the UK and be able to feed that back to authorities to enact action when needed. So direct injection of wastewater for non-target screening also required a little bit of tweaking of the targeted methods. So in particular we wanted to look at the injection volume. We tested between 10 and 50 microliters. We didn't want to go higher than that. The smaller the sample we have, technically that reduces massively the storage space for. All of the samples that come in, we see several 1000 samples coming in, uh, from not just wastewater but across our other projects. So really we want to keep the sample volume as low as possible and do multiple injections of the same, same sample. So we ended up with 40 microliters as our, as our preferred injection volume for QTOF, as opposed to 10 microliters for our target NMS. And as you can see, as you might expect, precision obviously, um, improves as you increase the injection volume, uh, up to a certain point. Um, detection limits, uh, generally in ultra pure water, they were better than in wastewater, as you might expect. Uh, they were just lower than the 100 nanogram per liter mark. So not, not perfect, but certainly enough to do a lot with. Um, and obviously the, the, as you go up in concentration, you can see the mass error in wastewater, um, decrease and improve. But generally, it was within 5 PPM. So I want to go back now to the logistics and citizen science for spatial resolution. So this is an example of how to sample an entire country over over a single weekend. And so what we see here is, uh, 2024, we got um a number of samples back. You see good spread across the country. Um, but overall we actually saw only a 26%, uh, recovery of kits that we sent out. Uh, one of the main things here was that we just, we sent out far, so many that not very few came back, less than a third came back. But also some of the, some of the bottles that were sent back and the kit we sent out needed to be a bit more sturdy because a lot of bottles broke. In 2025, it was much improved. We got 58%, um, returns on this case, and we've got, uh, nearly, nearly, uh, 1300 samples, which we, we see covering, uh, the full span of the United Kingdom, which will be very exciting to see the results of, uh, in, in their completion this year. But very keenly, the, the, the difference between the two is important to Learn from, I guess. So groups, so in 2024 we targeted community groups. We had to identify an individual, that individual was sent the kits for the entire community and then they needed to distribute. That was clearly a problem. We needed to go direct to individuals. So in 2016 we went straight to a sign up form online and the individuals were sent their kits rather than the group representatives. Uh, the bottles, as I said, caused a lot of problems. We moved to vacutainers used for, uh, things like blood, blood samples and blood, blood analysis, just with no, uh, embedded, uh, anticoagulant, and they worked extremely well. Very few broke, if any. The, the main problem across both campaigns here was that, um, the time it took to return samples varied. In some cases, we got them back the next day, uh, in many cases, it took a week. So we really have to look into the value of these, these, uh, samples that took longer. We did tell uh the citizen science groups to, to freeze the samples, so at least they'd be cold while in transit, uh, but obviously after a week, uh, we can't stand over that stability. So here are the results of the 1st 100 samples. Um, as you can see, still good coverage across, uh, the UK, uh, chemical detection varied, as did chemical concentration, as did risk, and they didn't necessarily always line up, um, no, nor should they, I guess. Um, the most frequent one was, uh, tramadol, uh, uh, that was an opioid, uh, medication. The most concentrated one was caffeine, perhaps as expected. Um, the, uh, and then the biggest risk one was a neonicotinoid, uh, emitoloprid, which interestingly was banned in 2018 for outdoor agriculture and now has seen a market shift towards its use as prophylactic tick and flea treatment in pets. And so we're undertaking a lot of work to understand where the sources of that come from, and we think it's mainly through, uh, untreated wastewater. So, as, as part of a study we did in 2020, um, we undertook a sample across London, um, during the pandemic, uh, but also in 2019 and then a follow-up study in 2021, um, and we wanted to see whether we could identify areas particularly impacted by, by pollution. Uh, as part of that, we did. suspect screening study and as you can see here, uh, we chose 5 rivers, picked the worst site on those 5, and a downstream site as well. Uh, using hierarchical clustering, we can see that the, the rivers pretty much, um, they, they group together and we could identify an additional 25 compounds on top of the target screen that we, we, we did as well. Um, we also found 7 biotransformation products, uh, as well as, uh, compounds that were present on the, uh, European Union watchlists. So really, we wanted to know, could we actually do a deeper dive than what we had on our library, um, searching beyond the 1200 compounds, mainly to understand the, uh, occurrence of biotransformation products. So in this study then, as a just like the last one, this is the this is the results of that. Uh, you can see here the locations of the rivers, but also of the wastewater treatment plants. Um, and our workflow involved taking the uh combination of what we found in the target campaign and the untargeted non non-target screening campaign, adding the two together and then generating, um. In silicon, the potential biotransformation products for each of these, um, if they were present in our library, great, we could assign a confidence level to those, but if they weren't, then we generated molecular descriptors and also predicted the retention time and then could use that to help identify the. Substances. We were able to consider both MS1 and MS2 data because it was data independent analysis, um, so that was, uh, that was really useful. And in the end, uh, what we found from those 905, uh, biotransformation products where you have MS1, MS2, and predictive retention time within 30 seconds, uh, you can see we found 90. Uh, so actually, This was, uh, this was substantially, uh, lower than what we started with. So, really the value of this, uh, in silica approach really helps us prioritize quite, quite, quite quickly. Here's our retention prediction model. This is 1200 substances. Uh, you can see very good prediction, usually sub-minute and down to about 30, 40 seconds. As I said, we take 30 seconds as a cut off for hours, and it worked very, very well, and we use this now across reverse phase chromatography. This, this column is a biphenyl column. It's not C18, so very good for measuring polar substances, but we're also now using this in SFC and also in Helix as well. So beyond grab sampling, then there is an option to use passive sampling as an alternative way to measure the kind of time integrated concentration of chemicals in waterways. We've developed a 3D printed passive sampler, as I alluded to earlier. It's a, it's a 5 disc housing set up about the size of a 50 pence piece. We put in 59 millimeter discs. They can be all the same or they can be all different. Um, we have two pieces that essentially sandwiched together and clipped together pretty much like a Lego brick, and it sandwiches the, uh, the discs into place. Uh, the discs are protected by a PES membrane to allow, um, uh, passage of substances across, but also to prevent biofouling. Uh, the absorbents look like this. They're commercially available absorbents. Uh, and you can see, you can just punch them out with a regular, uh, uh, 9 millimeter punch and they can, they can easily be be assembled for large scale deployment. So here's an example of it in in uh in application. One thing I should say is that when you reduce the size of the passive sampler, some of the commercially available alternatives are quite large, 47 millimeter disc size or even larger. These are 9 millimeter discs, and there's 5 within each. This also reduces the resource requirement for calibration. So we've calibrated these, these 3D printed passive samplers for over 100 substances using HLB. Uh, also HLB anion and HLB cion, uh, type absorbents, um, for, uh, water analysis. And in this case here, we're, we're applying just HLB, uh, and, uh, to, uh, sorry, this is a grab sample, um, uh, a transect of the River Wandle. Uh, and as you can see, moving from site S to site A, you can see the influx of wastewater effluent at site F. And these in the grab samples indicate that there's a significant, uh, pollution influx at this point. So we deployed passive samplers here over a period of 6 months. Um, and then from that we could do suspect screening and also water analysis, as well as analysis of benthic invertebrates, uh, such as Gamer's pulex, which we've worked on quite a bit. So here's the suspect screening results. Uh, below the wastewater treatment plant we saw nearly 100, uh, contaminants of met concern. Above that, clearly much lower, only 15. Uh, over the six month period, uh, we could see, uh, seasonal changes, and we could, we could observe all these different substances, uh, over that time period. It was an inherently concentrated, um, sampler, so it sort of did some sample prep in situ, if you like, uh, and allowed very, very high sensitivity measurements to be made. Interestingly, if you look at the concentrations measurement in the water using the direct. Analysis, the concentrations in the gammas poolex and in the three different types of absorbent, and in cine and neutral. The, the passive sampler actually explained more of the variance in, in the chemical occurrence, um, in, in the, in the gammas than, than the water did. So this really has, um, pushed us forward to look at passives as potentially a triaging mechanism for, uh, biomonitoring. And lastly, I'll just talk a little bit about our inar project, which again is a citizen science approach where we give these passive samplers to, to community groups. In this case, um, they're a little bit more tricky to deploy with community groups than, than grab sampling, um, most notably to try and affix them to to things and being able to get into the river safely. So we targeted, uh, people who are well used to, to, to rivers to start with. So these were kayakers and boaters and people who spend time in rivers quite regularly. So we're acutely aware of the, the safety. And as you can see on the right, we could pick up several different, uh, chemicals of emerging concern here, and mostly those that were more concentrated on the discs were, um, were those downstream of, of obvious pollution sources such as, as the wastewater, uh, treatment plant effluent. So this is now forming the basis of, uh, wider, uh, targeted monitoring. Our passive sampler, the material it's made of, it's methacrylate based, so we can actually do quite a bit of work now, uh, having done some extraction work on it to look at PAS. There's very few PAs in it, so it really gives us an opportunity to extend our applicable, applicability of this passive sampler into that space. So the key lessons really in terms of scaling up NTS and target analysis, they really should go together in our case, uh, it's been very beneficial, but really you've got to think about your logistics, how you're going to sample, who's gonna do it, um, what type of sample you're going to take, um, the type of kits you sent out, even if you think it's simple, uh, it can often confound you and confuse you as to why things didn't work out. Um, really, the size of the kit is very important. It massively increases the cost if the kit is heavy. Um, so really low, low weight, small, uh, and cost-effective kits are the, are the best way to go. We started by making rapid methods, ideally with direct injection, and that really helped a lot of things. You know, we don't always have to have the, the, the superior sensitivity. But it is enough for us to do in-depth monitoring at specific sites that might be under, under, under pressure from pollution sources. Really, the use of a library has helped massively to expand the information in each sample we've got, but also now using more intelligent predictive tools to try and predict what else might be there from the data set. I think one of the things that's really interesting for me is to see how we balance the citizen science with the science-led investigations and particularly how both sets of data can be used within a kind of a formal monitoring framework, and this, I think, is quite important. Many of us as scientists work as a from a sort of a risk-based approach. We often look for polluted sources and polluted areas, reflecting the worst case scenario. Whereas the general public may not, and it may also be governed by where they spend most time, uh, their perception of water quality versus reality is very important. And so there may be some calls for joining the two data sets together to see how reliable and how useful they are, uh, together to provide more context. I think for data, obviously in non-target screening, a large amount of data is generated. We really need to now start moving beyond the analytics, the identification. Um, and we're active across this, as, as are many others, looking at predictive, uh, toxicity to prioritize chemicals, look at the risk, forecasting them as well is a key area for us. We've done a little bit on source apportionment, uh, to find out where these things are coming from, not just wastewater treatment plants, but more diffuse sources and looking at land runoff and land use and so on. So that's it. I'll stop there. I'll thank the organizers for the kind invitation to present. Thank you for listening, and I'll take any questions now. Welcome to my presentation Non Target Screening Better Process Understanding through Comprehensive analysis. My name is Stefan Bieber, and I'm one of 3 founders of AfinTS, the Analytical Research Institute for non-target Screening. At Athintes we started about 8 years ago with the idea to support institutions who want to implement non-target screening as a routine technique. Coming from university, we had developed a lot of different software tools and analytical tools which were really helpful in using non-target screening in our laboratories, but none of these tools found their way into routine analysis. And so we came up with the idea just to provide basic support and consulting. Growing from there, we established education and seminars and as a site at the beginning we started to build our own laboratory where we now can offer also contract analysis method development as a service, but also application development and basic research which we still do a lot. So first of all, let's talk about non-target screening itself. What is non-target screening? We have a quite broad definition on that, and we define mass spectrometric non-target screening as a comprehensive and untargeted analysis combined with adjusted data evaluation workflows and statistical data interpretation. As you can see here already, there are two different things coming together. This is the analytical side, what you do with a sample in your laboratory, but also the data evaluation side, the question How do you handle your data and what do you have to do to condense out of your data the solution or the answer for your analytical question. If we talk about comprehensive analysis, we first of all have to think about the chemical space that we're working in. As you can see here, there's a list of different chromatographic techniques which might be usable for non-targeted analysis, but depending on the nature of your sample, you have to decide which one is the best to use. On the one hand, there is a group of hydrophobic compounds. They can be well separated by reverse phase liquid chromatography. If you want to go into a more polar region of compounds, then probably polar modified reverse phase liquid chromatography can be a great help. On the other side there's a group called hydrophilic compounds. And these compounds can hardly be separated by reverse phase liquid chromatography. And therefore there are other techniques like hydrophilic interaction liquid chromatography, so-called HLI, ion chromatography, and capillary electrophoresis. But as you can see already here, there are some drawbacks because only certain compound groups might be available or separable with these special techniques. There are broader techniques, of course, some things like mixed mode chromatography, but also SFC, chromatography with carbon dioxide. And there are some mixed techniques like couplings of hydrophilic interaction, liquid chromatography and reverse phase liquid chromatography, or 2D systems like 2D EC systems. And of course there's also the group of cheesy techniques and cheesy by cheesy techniques. These can be very helpful but go into a different chemical space. They are usually suitable for volatile and thermal stable compounds. In our lab we use two very distinct techniques the SFC, so chromatography with carbon dioxide, and the serial coupling of Hillig and reversed phase. So when we want to analyze a sample by non-target screening, we usually take the chemical composition of a sample and the group of compounds that we expect to be present in a sample as a first indication about the separation technique to be used and to be most suitable. After the separation, we use high resolution mass spectrometry for detection, and then we start with a data evaluation. And not surprisingly, as we do really sensitive analysis, our samples can contain several thousands of data points. And of course not all of these data points are really relevant for us. A lot of them are coming from background, from inserts, fragmentations, and so on. So the challenge is here to find clever ways to Condense the most relevant data points out there. Therefore, we, for example, rely on statistical data evaluation, and this will in an ideal way result in a picture like that where we only see a subset of all of these data points, maybe around about 500 to 1000 depending on the chemical composition of the sample. But these are the ones which are really characteristic for your sample and can help you to answer your specific analytical question, and for certain of those, maybe those who are most interesting for you, we can try to identify these compounds. Now let's look at process monitoring. You can see here a quite simple process consisting of 3 different processing steps, and what's happening here is we have different raw materials which enter the process in the first step. In a second step, another raw material is added, and in a third step, probably a downstream processing or a cleaning step, we end up with a final product. You can do that in the chemical industry, in pharmaceutical industry, in the food industry, wherever, so there is no limitation, um, where you can apply this. There are different levels in process analysis. First of all, there's the incoming goods inspection. Here you try to make sure that the quality of the raw material is as good as you expect it to be. Then in the end process analysis in control, you try to control all the process steps to ensure that the product is produced in the same quality as you expected, and of course you have a final product inspection where you make sure that the product is compliant to your predefined goals. All of these inspections and analysis are quite well fitted to the process that you're monitoring, and the test goals and targets can be, for example, the purity of the incoming goods or the final products, looking for target compounds, so the ones that you're actually producing or the ones which you already know are formed, some kind of known byproducts. But in process analysis, for example, you can also monitor process parameters or performance parameters. And all of these help you to get an understanding or to get a good monitoring about the performance of a process and to make sure that the final product meets the desired quality. But nevertheless, there are often situations where something is not working as it should, and just the statements that we have heard the last couple of years, something like our product behaves differently, but we haven't changed anything. You probably observed something like that yourself. Or we need to make more adjustments during the process, even though the raw materials haven't changed. Of course something like this can happen. The question is what happened in the process and Something like, why has our product suddenly turned yellow? Um, all of the factors that we are monitoring are the same, but something is now really different in our product. And that's exactly the stage where you can try to use the target screening to get an answer here. There are different things no target screening can be of help here. First of all, we can do molecular fingerprinting, um, but we just try to use these pictures here and to find commonalities and differences between different samples. This is, for example, used in authenticity or proof of origin analysis, and we also can do this in process samples. Another good option is. The capability of tracking changes over time or over different process steps, and besides the known byproducts, we can see a lot more compounds which probably you haven't been aware of that these occur in your process because probably they're not detectable in your final product anymore. And of course, we can try to look for unexpected residues, uh, so-called unknown compounds, and things that you just aren't aware of that are in there. This means that's the stage of identifying compounds. But identification of compounds is always quite a large challenge, so that's always something that you only do for a small subset of the compounds that you can find in a sample, those which you are sure are really relevant for your analytical question. I've brought you different examples where we have already used non-target screening and process monitoring, and first of all, I want to start to show you an example from coffee roasting. The study which we have conducted together with Schulli Mannheim, we have analyzed a lot of different coffee samples from different varieties and different stages, and you can see here the principal component analysis of the data set, and we can see two large clouds in here, one on the left side and one on the right side. If you look into the legend, we can see that. The one on the right side, that's the green coffee variety Arabica and variety carifora, and on the left side we can see the roasted coffee Arabica on the bottom and carifora on the top. So already with this type of analysis we are quite good in differentiating green versus roasted coffee, but probably there's also a chance to differentiate the varieties before and after roasting. Now let's look a bit deeper into the data. In this study we've extracted the samples with methanol water and then injected it into the serial coupling of reversed face and heli. The setup helps us to characterize the hydrophobicity of compounds based on their retention time. In the first section of the chromatogram, we see the compounds which elude from helic, which are the polar to very polar compounds, and in the second half of the chromatogram we have the compounds which elude from reverse phase liquid chromatography, which are the non-polar ones. Now if we look at the numbers here we can see around about 100 compounds eluded from hillock and about 400 compounds eluted from the reversed face column. That is the result for the green coffee. And if we now look into the roasted coffee, we can see that the numbers haven't changed that much. Of course we can see that there's a higher number of compounds in the reversed phase, 380 to 460, but as a compa number of compounds in hillig, but what we can see quite obviously is that these patterns here, if we compare the shape of these patterns have changed. So the chemical composition of the samples due to the roasting process obviously has changed. Now let's just pick some of these dots and have a closer look on what is that. So we can take different spots from here. We can get the extracted ion chromatograms where we can see that of course that's a chromatographic peak with a certain mass that we have detected and depending on the sample itself there are different high abundances in there and that's also what it can do for reverse phase and for helix. And then we can try to cluster these and to see if there is a difference in the compound abundance due to the green and the roasted coffee, and for that point, for example, we can see that as a quite intensive signal in green coffee. Over the different coffees that we have analyzed and hardly any signal in roasted and for the signal here on the right, it's the opposite situation we hardly have any signal in the green coffee but we have quite intensive signals in the roasted coffees. If we now want to get an impression about the behavior of compounds between the groups, for all of the compounds that we have detected, we can use, for example, something like a volcano plot. In a volcano plot we have on the x-axis the so-called fold change, so that's the ratio of intensities of a certain compound between two groups, in this case roasted versus green, and on the y axis we have the statistical significance expressed as a p value. Now how do we interpret these types of graphics? On the right side here we can see the compounds which are statistically significant and characteristic for roasted coffee. This means these compounds here have a higher significance in roasted coffee compared to green coffee, while those on the left side have a higher significance. In green coffee compared to the roasted coffee, now with the information about the process that was used, the roasting, we can now hypothesize that these compounds here present in the green coffee with a higher abundance than in roasted coffee are some kind of degraded by the roasting process and probably not present anymore in the roasted coffee or with a significantly lower abundance. While on the other hand, these compounds here which are characteristic for the roasted coffee, these might be the compounds which are formed in the roasting process. And so we can try to connect some of these dots with each other and probably find the precursor and the resulting compound which has been formed or degraded through the roasting process. And of course now we also have the option to look a bit deeper into the subgroups. So what is characteristic for green coffee and what is characteristic for roasted coffee? And if we plot these characteristic compounds for green coffee into the retention time mass plot here highlighted in blue, We can see that a lot of these compounds originate from the helix separation, so a polar to very polar compounds, and but there's also a group of compounds which have been eluted from the reversed phase. And if we compare this with the compounds which are characteristic for roasted coffee, we can see that the pattern is changing. And of course there is still a group of hydrophilic and very polar compounds, but it seems like the group of nonpolar compounds, those eluting from the reverse phase, is increasing. But that's exactly what you expect from a roasting process, which is basically a Mayard reaction where you form more unpolar compounds from polar compounds. So we can see exactly this just by an untargeted analysis where we just look on the basic characteristics of this process. Now to an example for the application of non-target screening in beer monitoring or monitoring brewing processes. In this study, which we have conducted together with BLQ and Freising Wein Stefan, we have analyzed different types of beer from different breweries, and what we can see here, there are different groups of beers that cluster together. On the top there is the group of white beer. You can see here, then on the bottom left there's a group of Pilsner beer, and in the middle there's a group of light beers. And of course you don't have to be an analytical chemist to differentiate these beers. You just can drink them and you will taste the differences in here. So it was not interesting here to differentiate these types of beers, but it was interesting to see the differences in one certain beer group, the light beers here. If we have a deeper look into that, we can see that there's 3 different breweries in here. So brewery 1, brewery 2, and brewery 3. Now we had a lot of samples from brewery 3, and now we were interested in, What is the difference between these different beers as you can see here, we've analyzed all of the samples 3 times for statistical reasons, and yes, they cluster together, the replicates at least, but there's a difference between the samples from the left to the right along PC 1. This here is the loading plot, so that just shows you the amount of compounds that were detected and how they correlate with the different samples and the different samples groups in here, and we talk about approximately 3000 chemical compounds which were characteristic for the different samples and led to this clustering of samples in the PCA. Now if we zoom a bit in there, that's just the group of the light beers from this one brewery, we can see that there are two samples which are really far located from each other, and that's the sample 1710 and the sample 2811. All the others are closeted here in the middle, probably with a different trend, but the difference here seems to be the largest in the sample set. If we look into the volcano plot of these two in comparison, we can see that there's approximately 480 features which are characteristic for the sample 2811, while there's 80 features which are Characteristic for the sample 1710 and all of these others here in the middle, they probably have the same abundance or the same signal intensity in both of the samples, so they are not characteristic for one or the other groups but probably are the background of the beer themselves. Now if we take one of these dots here, just mark in blue on the top here, we can see the extracted ion chromatograms, and here you can see the intensities of the peaks in the different samples that we have analyzed. Of course there's a difference in here, so there's a smaller signal intensity but also higher signal intensity. And accompanying that we have the mass spectrum and we can see that the detected MC value for that was around about 172.09799. In the trend chart we can see the intensity of this compound over all of the samples that we have looked at. We can see all of the different beers from the same brewery. And the area here with the according arrow bars and what is obvious here is that the 1710 is the sample where this compound has the lowest abundance by far and the 2811 is the sample where the abundance is the highest in the whole sample set. So that's exactly the reason why we found this compound because it was so. Characteristic for the 2811 in the comparison to the 1710. What you also can see is that this compound is present in both of the samples. It's not that it's just present in the 2811 and absent in the 1710. No, it's present in both of them, but just with really different signal intensities. If we now want to find out more about the background of this compound and why it's probably relevant for beer, we can try to annotate or to identify it. Thanks to the high resolution mass spectrometry that we're using, we can predict some formula based on the detected MC value. In the case of this molecule, we got a predicted sum formula of C18, H15, NO3, and we have used this sum formula and ran it over different databases, and we came back with a structure proposal based on the mass and the sum formula which looked like that, some type of amino acid. Um, with a functional group in there. In the next step we did in silico fragmentation, so we used the structure proposal and predicted MS2 spectra out of that and compared that with the actually acquired MS2 spectrum, and here you can see the overlay. And all of these green mark ones are signals that we had detected in our measurement, but also can be explained by the in silica fragmentation, as you can see there's a really good match in here and so we have a quite high confidence that the proposed structure, which is an acetyl isoleucine. is also the compound that we have detected and so we now have a quite good idea what that compound could be and now we can look into the different raw materials that were used and try to find out where this compound is coming from and ultimately find out if this plays a role in the brewing process and can affect the product quality at the end. Now coming to the last example where we used non-target screening to estimate the activated carbon dosage and try to assess the absorption capacities of activated carbon. In this study we had polluted water samples and we wanted to find out what dosage of activated carbon should be used to remove a significant amount of the pollution from the water samples. Therefore, we used 5 dosages of activated carbon ranging from 10 to 250 mg per liter. You can see here the different dosages in the waters. We incubated this for 4 hours on the steering. And after filtration we analyze the samples with our equipment in the lab. In the whole data set we could detect about 41,000 features, but the filtering and the data evaluation allowed us to narrow it down to approximately 500 features which were highly significant and characteristic for the different activated carbon dosages. And on the right side here you can see the PCA. And the different dosages are marked here and not surprisingly, the low dosages of 10 and 20 don't show that much difference to each other, but if we increase the dosage to 50, 100, and 250 mg per liter, we can see that the The location of these groups is changing and probably if we want to look for an effective dose, it is obvious that the 50, the 100, or the 250 would be the dosages of choice in comparison to the 10 and the 20 mg per liter. But of course we can look a bit deeper into that using volcano plots, for example, if we compare here 10 versus 20 mg in the volcano plot, we can see that most of the detected compounds are located here in the middle where there's no statistical significance. So there is probably not a real big difference if you use 10 or 20 mg per liter. It looks a bit different if we compare 10 to 50 mg. Then we can see that a certain amount of compounds is moving to the left, which means that these compounds have a higher intensity in the 10 mg per liter dosage samples compared to the 50 mg dosage sample. But nevertheless, the majority of compounds remains here in the middle and is unchanged. It looks a lot better if we look into the comparison of 10 versus 100 or 10 versus 250, but we can see that there's a continuous shift of compounds towards the left, which means that the signal intensity in the 100 mg per liter samples is significantly lower compared to the 10 mg per liter samples. The same is true for the 250 mg liter per liter samples, and In comparison of the two, we can see that there's still a group of compounds which is located here close to the middle. Um, which means that are not affected that much in intensity due to the dosage, while this group is completely missing here in the 250 mg per liter, um, dosage samples. So as a summary of that study, we could conclude that if you want to have an effective dosage, you should probably use 100 mg per liter or ideally 250 mg per liter because these might allow you a significant reduction of the chemical compounds contained in the wastewater samples. And with that, I'm coming to the conclusions. I hope I could show you that non-target screening can be of great help in process monitoring and ultimately lead to improved process understanding, but also to improved process control. Thank you for your attention. If you have questions or samples to analyze or even think about implementing non-target screening in your lab, then please get in touch and contact me. Thank you very much to all of our speakers for sharing your expertise and walking us through those exciting frontiers in non-target screening. So we are now ready to start the live Q&A session and we'll get through as many questions as we can. Um, so to start with, Ian, you said that people use untargeted and non-targeted screening in subtly different ways. Um, and you use untargeted in your presentation title. So an interesting question to start with might be, is there really a difference between untargeted and non-targeted screening? Well, I was, I was rather, yeah, I was rather hoping that there was, um, but I think it's just a cultural difference. So people have been using untargeted screening in uh metabolomics as a term since it started. Right, now, I think there are varieties of what's called untargeted screening in metabolomics, and I think we would really have benefited from being able to distinguish between what I consider to be fully untargeted, i.e. you don't know what you're looking for and you don't know what you've found. And the uh panel-based, well, we know what we're going to look for, we just don't know how much it will have changed, and that would be non-targeted for me, and the untargeted version would be there, but listening to the last presentation, it seems to me that many of the methodologies that are being used there are the same ones that I'm using in sort of mammalian metabolomics. So, um, That's a pity because I think it would be a really useful distinction. Does anyone else have any thoughts on, on that? Yeah, I, I, I agree with Ian and I think, you know, that the historical context is, is, I guess, untargeted. So I kind of agree with his, his, his thinking on that. I think that Traditionally, for me at least, and again, this is probably just a cultural thing, the, the non-target screening kind of moniker, generally in my, my sphere, it seems to refer to, you know, external contaminants rather than necessarily biomolecules. But I quite like what Ian said is that it's really hypothesis generating. And in our case, in environmental, we don't always know what the source of the change is. It's quite complicated. Um, so we, we, we don't, we don't always have control over that, I guess, but Yeah, I, I, I tend, I tend to agree with Ian. I think, I think it's a cultural thing, but I think I'd, I'd like a differentiation between the two. Makes sense to me. What it is, I don't know. But that's my context. Well, perhaps we can start to define, if we can agree that there is a difference, we can start to define what it is. Um, whether the rest of the world would follow us, of course, is something else. I think Ian, there is a difference in if you think about a fully untargeted approach or typically using a maybe a full spectrum analysis um or maybe a HRMS instrument um when they're doing LCMS. In the approach that you described, um, what you're looking at there is, yes, you have pre-selected components, but because you're using like an MRM based approach, you've got very specific transition. So you have a form of specificity that in some ways removes the need to identify that component if it turns out to be one of interest. And also um compared with a a full spectrum type of analysis. Probably got a lot more sensitivity because you're using that MRN, the specificity of the MRN detection. Yeah, Sabrina. Uh, yeah, so, to me, the two terms are rather similar, but, um, in detail, they mean a little bit different things. So, to me, um, the untargeted is more like an discovery-driven approach, um, where we are looking and measuring the, actually everything which is detectable, but in more rather, um, yeah, somehow, Hypothesis driven space where we can use databases and then match the data against databases. And non-targeted screening, I'd rather account for scan for everything and have this truly untargeted or truly non-targeted approach where I actually do not know what I'm looking for and also without having the search space, um, where I have to look for, and then we are in the context of this chemical space, space, which is Much, much, much, um, bigger in the non-proteomics field. So we're using the same terms to mean exactly different things. Which is going to be a real problem because who's going to blink first, the proteomacists or the metabolomaists, as they don't even talk to each other, it's unlikely that the change will happen. But, you know, we should discuss it because if you're saying that you believe that untargeted means something completely different to what I mean, when we do start to have a conversation, we're going to confuse each other hugely. I totally agree, and I think that's, uh, why it's so important to discuss this and to make really clear what one means and what you refer to when you use those terms. Well, to be honest with you, discussion, you bring me in a really bad position because I worked for the Institute for Non-target Screening and I just realized that we mostly do on-targeted analysis based on your definition. So, um, I'm not so sure if we really need to, to go into this discussion so deep because what comes to my mind now is if we differentiate between non-targeted and non-targeted screening, Where's the boundary to suspect screening? Because what we often see in labs is that they say they do non-target screening, but what they really do is they do a scan experiment and then they look for things that they already know in there. Uh, I'm not so sure if there's such a clear boundary there where you can go from suspect screening to non-target screening to untargeted screening. I'm sure there isn't a clear boundary. But I think, you know, as Sabrina said, we need to get the conversation going so that we all realize that we all may be talking about completely different things. Um, at least if there's an acknowledgement that I mean one thing and you mean another. Rather like the difference between American English and British English, you know, you can say the same thing, but it doesn't mean the same thing. Um, and that has been the cause of problems in the past. So let, let's avoid having problems, but let's, let's say they can be used equivalently. Or in particular fields, they may have a particular meeting, but we, we need to, we need to ask the um, We need to get it out there, and as I say, it's only because of this symposium, or whatever this is that we're in, that, that I actually began to think about it strongly, because I've never had to think about it at all, which is my default situation, you know, if you don't have to think about it, don't. You know, it sounds like this could be a bit of an ongoing conversation uh for the field. Sounds like it ought to be an editorial for the Analytical scientist. What do I mean when I say what I mean? You read my mind, so hopefully we can keep that going. Um, well, perhaps we can turn to a, a couple of questions from the audience. Um, so this, this one came in towards the end of your presentation, Ian. Um, so I, I think it's for you and it asks what programs do you use to analyze perturbations, uh, to metabolic pathways? Well, the very simple answer to that is I don't use any programs. Because to use a program, I would have to have a hypothesis. That would justify it. Now, what I see is things going up or down. Right? Now, the simplistic interpretation of seeing something going up is that more of it's being made, yeah. And the simplistic reason that something might be going down is that less of it is being, uh sorry, more of it's being used. Or less of its being made now. Things can can be going up because they're not being used. So To plug something into a program, I need to be, I firstly need to believe the program worked. Um, and I'm an old man, so I'm very cynical about some of these programs. And secondly, that I know what's going on. If what, what I'm using metabolomics for is to find things that are clearly changed. To find out the direction that they're changing. Well, I can go to a textbook and find out what the metabolic pathway is, I don't need to go to a program. And I can say, OK. What's the thing at the beginning of the metabolic pathway here, or at the end of it? Let's do a flux experiment. Right, and that's a completely different bit of science. Flux experiments are not metabolomics, they are uh pure biochemistry, and that will tell me the rate at which things are going through a particular pathway, and the rate they're being used. And in fact, sometimes, because the body is very good at homeostasis. Concentrations don't go either up or down, they, even though they're being used at faster rates or slower rates, so sticking programs in, I think using programs has a place, but I think, I personally think that that place is when you know what's going on. You have a better idea of it, so the metabolomics gives me targets. It doesn't. Necessarily give me answers. OK, thank you. Um, so I believe this next one is for you, Leon, and I say one, but it's kind of a barrage of, of questions, but I'll, I'll read them out, um. It says, how do you reduce false positive hits in your suspect screening? Can you remove ESI unamendable compounds from your suspect list? Which software do you use for suspect screening? Um, I saw that you're predicting retention time, which methods do you use? So there's a lot of questions there. I don't know if you could maybe pick out um an interesting aspect to to focus on. Right, great. Let me try and keep this as brief as possible while hopefully pointing you to places you can read the full and detailed answer. Um, but the first thing I think is how do we reduce false positive. That, that is the elephant in the room. Yeah, for anything to do with suspect screening in environmental matrices. What we've done, uh, for this approach is we have run calibrate targeted calibration lines, yeah, for a couple of 100 substances. We've got the, um, we've got the slope, the intercept, we can solve for the uh ionization efficiency, essentially, looking across all of the compounds. And from that, then we define a kind of a minimum ionization efficiency that we would expect for a compound within that separation space. For us, it doesn't really mean anything until you see the data, but for us it's an ionization efficiency of 2, which is a log value. Um, and if, and just to put that in context for environment, if you, if you go to, let's say, uh, large suspect screening databases for environment like the Norman SUSA database. Uh, that means that about, if you apply that to value, we actually lose about 30% of the compounds in that database through, uh, setting that lower boundary of ionization efficiency. Um, but that actually does make sense for us because actually the SUSASUSTA database is enriched with very polar hydrophilic compounds that we may not necessarily even be able to retain by reverse phase liquid chromatography. So, I'm not entirely um unhappy with that, bearing in mind that every single sample that we run is positive, um, for, for substances. So that's the first question is probably a bit longer than the rest of the answers I can give. Um, can you remove ESI unamenable compounds from your list? Yes, but we, we have to make an informed decision on the fact that there may be things that we could see, but have to put a lower boundary in, but we're lower in confidence for them. Generally, just, just to put it in context, an ionization. efficiency of 2 for us equates to about 250 nanograms per liter. Uh, if you go to 2.5, that kind of represents 2.5, sorry, 25 nanograms per liter. So, actually, it's quite a, it's quite a massive difference between the two for us in terms of um setting that lower boundary. In terms of the um software we use for suspect screening, it's a library search from our standard software that we get with the instrument we've got, but everything then is subsequently checked. Yeah, we, we don't just trust the program exactly as Ian says, we want to make sure that we're actually reporting what we think. Um, we use retention time tolerances, we look at mass, um, uh, errors, we look at, um, precursor product lines. It is data independent analysis. So there's only so much we can do with that, I guess, but we can follow it up with a dependent analysis screen if we want to be sure, and we can also use our targeted screen, which is more sensitive. So, um, that's, uh, that's that, um, predicting of retention time. So I developed a machine learning based retention tool back in 2012 for the, um, for the application to the Olympic Games, anti-doping testing to be able to go back and look through data sets for new compounds that might appear later, and then you could start to get the samples to confirm them in the B sample. That's a machine learning based approach published years ago. We use the same type of approach for um SFC as we do for um for Helix, uh, but with different, obviously chemical, um, molecular descriptors governing how that retention is predicted. Um, we've done that for thousands of compounds, with multiple methods, probably about 50 or 60 methods at this stage. Um, and the last question I think is, um, I think that's it. Which method do I use? Yeah, that's it, machine learning. That's it. Hopefully that was brief enough. Yeah, great, thank you. So this next one, I mean we've brought together uh researchers working in different application areas, different frontiers in non-target screening. But if we think about the NTS field as a whole, um, what would you say are the, the biggest kind of scientific or practical challenges um facing the, the NTS field? Does anyone have any thoughts on that, Leon, you'd like to kick us off? I may be a bit cynical, getting people to agree with each other. I think that is the biggest challenge in NTS. I think the technology is wonderful. I think you can do so much with it, but actually getting people to agree on how it's appropriately used, the terminology that we use, as Ian said, is important. It's important to be clear. Um, so that, that's, I can talk about techniques, but I'll let someone else speak. But for me, that's the biggest one. Yes, Sabrina, I don't know if you agree or disagree. I definitely agree. Um, and I would like to add one, point is communication with, with the stakeholders. So how we explain untargeted, um, data to Um, regulators to the public, uh, and, and so on. I think that's a very important point, especially when we're talking about uncertainties. What does identified really mean? And does this identification, um, has any consequence and, and so on. I think that's one of the biggest challenge as well. Adding to Leon's comment. Yeah, I I think myself, one of the biggest problems in metabolomics is misidentification and an overreliance on databases. Um, I know we've had this sort of discussion before, but one of the problems that I see is that people, Believe the database and they will take a Uh, a single mass and put it into a database, and it will come up with a match. It'll all have to come up with a match because, you know, there isn't a mass that doesn't relate to a compound somewhere in the, in the chemoverse. And then they believe it, and then they try and put it into biology. Um, so you'll find things identified as biomarkers of age that are only found in, in sea squirts or poison mushrooms. Things like that, and I think that is a real problem in non-targeted screening or untargeted screening. People forget to use the most important and expensive instrument in the room, which is their brains. They tap a number into a, uh, into a computer, it goes to a database, it comes back with an answer, and they accept it. Um, so, there's a huge education problem here. I mean, you see people reporting D or L amino acids when they're using an achiral chromatographic system, so they cannot possibly be correct. They've got a 50/50 chance. Or, or possibly it's a, it's an algemerically equal mixture. But, you know, that is a big problem, the technology. Can be more dangerous than the. Then we give it credit for because we simply don't think. And you have a recent paper in, in this area, right, Ian, that people could could check out. Yes, people can metabolomics, but all they need to do is read the Analytical Scientist, which is doing a great job of showing this sort of stuff. I mean, because you've also reported on Jeremy Nicholson's work on untargeted analysis using NMR spectroscopy, you know, the forgotten technique in analytical chemistry, um, and showing that for one important metabolite that's found in either human or. Rodent urine There's only one, there, there are two things that give very similar spectra, and only one of them is in a database, and that's the one that everybody reports. So 50% of the papers that he looked at actually had an incorrect identification in. Right, because the people who'd identified it, identified it, hadn't done the simple thing of going back to the textbooks and finding out whether it was actually likely. Go in the database, when it fitted the spectra. Oh. I mean, what do you do when that happens, because eventually with AI scraping all of these things out together. The severe danger is that these fictions will become facts. Yeah, I'm getting to be too old, I think. Leon, you, you want us to come in on that? Yeah, just, just to say, you certainly you're not too old, and I feel the same way. Um, recently, a really good environmental, but also biologically relevant one was microplastics in humans. You know, you physically cannot get some of these particles into a human brain, yet people are being led by the pyrolysis GCMS data to say, oh, look, we've got a, you know, a great big bottle cap in everybody's brain. Um, and I think that the worry I have a little bit about, um, uh, I think about non-target screening is especially, and I have to be careful here, is where, um, clinicians and medics get to use the information. And this was a clear case here. Um, where they are not mass spectrometrists and they're not advised by an analytical scientist as to what the data means, nor is it plausible. So, the point being that I think, you know, that has led to a gross misperception of risks of microplastics or the scale of what we actually truly know, yeah, in terms of risk. So it's, it's perhaps from an environmental standpoint, but I totally agree with you on that one. You've read my mind. I didn't want to use that one as an environmental expert on the line, but I mean, the biggest problem that I think we have is that The the analytical chemistry needs to be done by analytical chemists. The medicine needs to be done by meds by doctors, and the biological interpretation needs to be done by biochemists and the informatics needs to be done by an informatician. You need a team. And some people haven't got a team, so they use a database. Can anybody see a problem with that? Well, I think I see it every week I get publication papers sent to me because I'm for my sins edit the Journal of Chromatography B. And every week I'm able to desk reject about 50% of what I get because it is nonsense. Elegant science supported by, sorry, elegant analysis supported by bogus science. Stefan, did you wanna, um, I totally agree with all of what you said. Um, I think we have the challenge here that we are, that we often have to bring relevance into our data and as analytical chemists, we often don't know that much about the samples that we're analyzing to really give the suitable answer. So we need to know what we're good at and find experts where we have no idea about it. And we often see that in our field where we work, when clients come to us and send us samples and say, we have a sample, we want to know, is there something toxic in there? And my answer is we can analyze it, but I cannot tell you if it's toxic or not because I'm an analytical chemist. I can tell you about the masses and the retention times in there, but the toxicological relevance, that's not my field of expertise. Of course I can give you ideas about compounds which might be contained in there, but we are not 100% sure about that because identification is a challenge itself. And then you need a toxicologist who can give you the answer if that compound might be of relevance for your sample. So that's an interdisciplinary approach. We need to be aware of that. I think, I think you can add to that, Stefan, I think you have a good point. It's when samples have been collected and they're analyzed out of context. Uh, so if you, if you've not collected the sample in in the correct way, um, in with the with the correct chemistries and stabilization and then you're asked, well, well I've got these samples in the freezer that we've had for a couple of years, can you analyze them? Um, you know, we, we have a, we're about to embark on a very, um, interesting study around obesity, and the clinician we're working with, I, he's a really nice guy, um, very open to listening, and he said, well, can we look at the GLP1 components? And I said, well, you, you've gotta make sure you collect them in the right con container, otherwise they're just gonna absorb onto the container and my measurements are gonna be. Um, invalid. And you know, he's taken that all on board and he's got the right things and we should have a good experiment, but when people come after the fact and they've already collected, collected those things and ask you, well, can we analyze this and can you analyze that? Um, things like a lot of the phosphorylated and the, um, low concentration bioactive lipids that are phosphorylated, they will slip as well. So if you haven't made the taken the right precautions with your sample collection. Can be interpreted in these, you can get to Leon's point, you can do like great analytical science, but don't just focus from the beginning. So I think we really need to think about that um when we collect these samples, these um you know this sort of phrase context of use of what you're gonna do with it, you've got to start from the, from the beginning and not just analyze samples cos you've got them in the freezer. Yeah, so we're, we're pretty much out of time, but um it would be nice to finish on a, maybe on a positive note. So maybe um a nice, a nice question might be. You know, thinking about the frontiers we've heard about today and, and maybe some others that, that weren't covered, um. Where, where do you think NTS will, will have the biggest impact, um, over the next 5 to 10 years? Some, some maybe brief thoughts on, uh, particularly exciting application areas. Anyone like to to jump in on that one? It will potentially allow us to do really personalized medicine. I mean, you know, now is the best time there has ever been to be an analytical chemist because we have the tools and there are enough people with expertise around to actually make a difference. So I hope we can really begin to understand how drugs work. I mean, You know, what does TKI do? I haven't the faintest idea, but you throw a drug in that affects TKI. Um, and the whole metabolism changes. Right, so it's doing a lot and, you know, we need to know this, and now we stand a chance of being able to find it out. And Leo. I, I think, and it, it reflects across all the speakers today, and I guess many in the audience as well, it's the versatility of it. Um, so you can study the metabolism and the impact on it. You can study proteome, you can study the xeno exposome if you want another strange word. Um, but you, you can vers vers versatilely, if that's a word, um, sort of, uh, apply the technique to understand impacts of chemicals in the environment, not just to identify where they come from, their sources, but then all the way through to the biological mechanism that underpins its impact. I, I just find it. Underused, underappreciated. I think, you know, certainly in the drinking water space, Stefan and I published a paper showing that only 170 substances had been identified in drinking water in the last 10 years using high resolution mass spectrometry. That that's catastrophically low. It should be much higher than that. Uh, the water isn't that pure, um, nor should it be, should I say. Um, but the point being that I think it's the versatility of the technique that gives us that start to end with a bit of NMR in there as well. Yes, Sabrina. I agree with this. And um I also think if we can push the boundaries, if we go from the compound centered approaches to more pattern centered approaches, where we can see changes in pattern. We do not necessarily need to know what, um, which compound is responsible for this change in pattern, but Simply seeing patterns change can help us to get an early warning system, for example, it can be in the field of processing. It can be in, in the field of foods when we talk about food fraud, when we talk about packaging migrants, stuff like this. So I think we have a powerful tool at hand, and now we have to develop it further to gain more knowledge and to use this knowledge than efficiently. Yeah, I would say We have the opportunity to really understand um human health, um to a deeper degree and the ability to maybe integrate data sets um from. Disparate research laboratories, um, and combine the kind of OMICS data with, um, with the sort of environmental data that Leon was talking about to really get at. Begin to move down the path of being able to map people's lifestyle journeys and um identify the right places for intervention. And the more we go down this route of reviving. Data on specific compounds and components and be able to integrate those across various these large data sets that exist from biobanks around the world. I think we can, we can really learn a lot about why to to Ian's point, why drugs work in some people and not in the others, in others, the effect of uh the aging population, um, all these things to think really help um. The healthcare industry to go and provide new products for the future. And as I see it, untargeted analysis or non-targeted screening has the potential to change our way of, of seeing the world because we can see things that we haven't been aware of so far. Um, so wherever you look at it, it's food analysis, if it's metabolomics, there's so many unanswered questions and with every sample that we analyzed, there are new questions coming up that lead us further. Um, so yeah, I think that's really the, the, the nice thing about untargeted analysis and on target screening that, yeah, we will never reach a point where we say, we know everything now. OK, well, an exciting time to be an analytical scientist, especially in this field. Um, I think that's all we have time for today, but thanks to everyone for answering those questions and uh great discussion, hopefully we can keep the conversation er going. Um, so if you wish to revisit any of the topics covered today, then this webinar will be available on demand in the next couple of days. Thanks again to Ian, Rob, er Sabrina, Leon and Stefan, and thanks to all of you for attending. I look forward to seeing you at future webinars.